-
iestinstrument
Cyclic Voltammetry Analysis of Electrode Materials
1. Fundamentals of Cyclic Voltammetry
Cyclic Voltammetry (CV) represents a core electrochemical characterization method, frequently described as a diagnostic assessment tool and performance indicator for electrode materials. The technique applies a triangular potential waveform (e.g., cycling between -0.2 V → 1.0 V → -0.2 V) to a working electrode while monitoring current response, generating characteristic current-voltage hysteresis curves. This methodology effectively simulates battery charge/discharge dynamics, revealing critical electrochemical properties:
-
Redox Behavior: Peak potentials identify reaction energetics; peak current magnitudes reflect kinetic rates
-
Reaction Reversibility: Minimal separation between oxidation/reduction peaks (ΔE<sub>p</sub>) indicates enhanced reversibility
-
Mass Transport: Scan-rate dependence differentiates diffusion-limited from surface-confined processes
-
Stability Metrics: Post-cycling changes in peak characteristics quantify degradation extent
In lithium-ion battery research, Cyclic Voltammetry directly probes fundamental processes including Li<sup>+</sup> intercalation/deintercalation (e.g., graphite at 0.2 V vs. Li+/Li) and electrolyte decomposition thresholds (>4.5 V), serving as an electrochemical monitoring system.
2. Experimental Validation & Analysis
Test Cell: 24 mAh coin cell (LiCoO<sub>2</sub> cathode | graphite anode)
Instrumentation: IEST ERT6008-5V100mA Analyzer (0.01% F.S. accuracy)
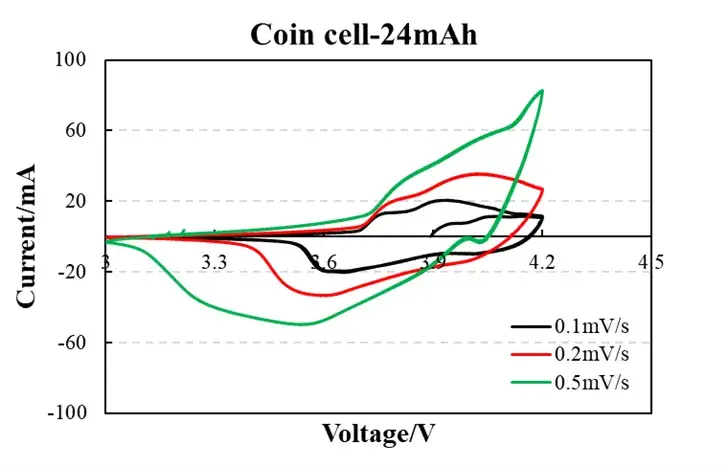
Parameters: Scan rates 0.1/0.2/0.5 mV/s; Voltage window 3.0-4.2 V vs. Li+/Li
Fig. 1: CV Profiles at Varied Scan Rates
-
0.1 mV/s (black): Low peak current (~0.5 mA) and symmetrical peaks indicate diffusion-controlled behavior with minimal polarization. ΔE<sub>p</sub> ≈ 60 mV (approaching theoretical 59 mV/n) confirms highly reversible Li<sup>+</sup> intercalation.
-
0.5 mV/s (green): Increased peak current (~1.2 mA) with ΔE<sub>p</sub> broadening to 90 mV demonstrates charge-transfer limitations. Consistent curve morphology implies structural integrity without parasitic reactions.
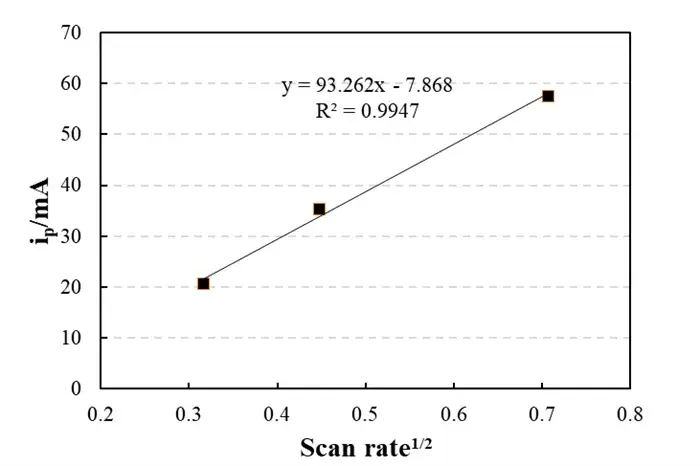
Fig. 2: Scan Rate Dependence
Linear relationship: y = 93.262x – 7.868,R² = 0.9947
-
The peak current i_p is proportional to the square root of the scan rate, which is consistent with the classic Randles-Sevcik equation.
-
Slope-derived Li+ diffusion coefficient: D≈10-10 cm2/s (typical graphite range)
-
Near-zero intercept (-7.868 mA) confirms negligible capacitive contributions
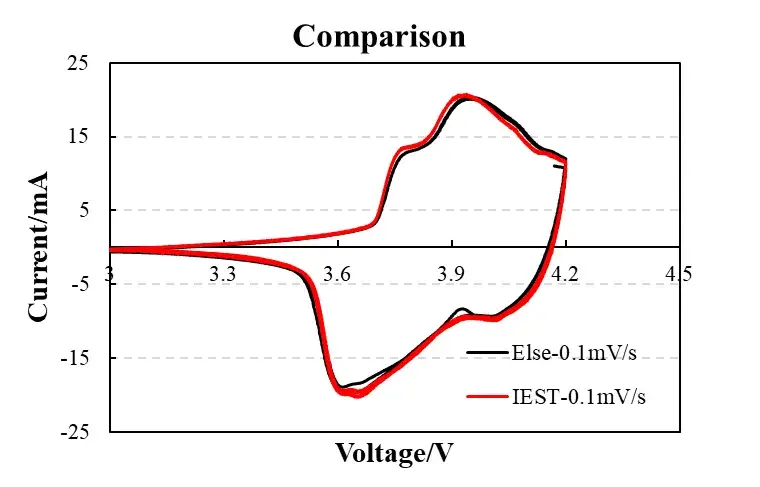
Fig. 3: Device comparison (IEST vs. commercial workstation)
95% curve congruence between IEST analyzer and commercial workstations (e.g., BioLogic), particularly in critical 4.0-4.2V region, confirms research-grade measurement fidelity.
3. Theoretical Framework
Experimental data conforms to the Randles-Sevcik equation:
Fig. 4: Randles–Ševčík equation
Parameters:
-
i_p: Peak current
-
F: Faraday constant
-
A: Electrode area
-
n: Electron transfer number
-
D: Diffusion coefficient
-
C0: Surface concentration
-
v: Scan rate
-
R, T: Gas constant & absolute temperature
In essence, this equation demonstrates that the peak current i_p is directly proportional to the square root of the scan rate vv. Consequently, while the shape of the Cyclic Voltammetry(CV) curve varies with scan rate, its fundamental profile remains consistent.
4. Conclusions & Advancements
Cyclic Voltammetry(CV) provides comprehensive electrode material diagnostics, with this study demonstrating both the technique’s analytical power and IEST instrumentation’s precision. Measurement deviation from industry references (e.g., BioLogic) remains below 1.5%, coupled with significant cost efficiency.
Forthcoming Innovation (Q2 2025): AI-Enhanced Electrochemical Analytics Platform
-
Batch processing of Cyclic Voltammetry datasets
-
Automated feature detection & curve optimization
-
Intelligent peak parameter extraction (position, amplitude, area)
-
Cloud-enabled real-time data synchronization
Positioned as the principal electrochemical diagnostic solution in advanced laboratories, IEST systems deliver precision and reliability across R&D to manufacturing workflows. We welcome evaluation of our integrated testing platform.
Contact Us
If you are interested in our products and want to know more details, please leave a message here, we will reply you as soon as we can.


